
def n = 100 * 1000
def at, bt

bt = System.nanoTime()
n.times {
    def sb = new StringBuilder()
    sb.append('foo')
    sb.append('bar')
    sb.append('baz')
}
at = System.nanoTime()
println((at - bt) / n)

bt = System.nanoTime()
n.times {
    def sb = new StringBuffer()
    sb.append('foo')
    sb.append('bar')
    sb.append('baz')
}
at = System.nanoTime()
println((at - bt) / n)
But the result was against expectation. StringBuffer is more than twice as fast as StringBuilder (Groovy 1.8.6、JVM 1.7.0_04-ea Server VM). It must be worse than or equal to StringBuilder even if the cost of synchronization had been written off by optimization. It means this measurement completely failed.
StringBuilder   1947.3 (2.76)
StringBuffer     703.1 (1)
The failure was more obvious by comparing between StringBuilders:
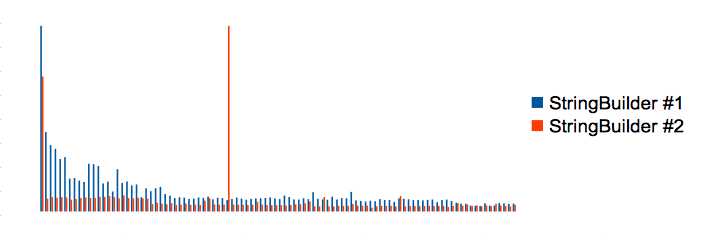
StringBuilder #1   2030.68 (4.85)
StringBuilder #2    418.47 (1)
The changes of the execution times shows us what the problem was. Some optimizations had been finished in the first time measurement and the second time measurement had started from where the optimizations were finished. Thus, the first time has a disadvantage. And there is an outstanding value in the second time measurement. The value is because of garbage collection and garbage that was collected at this time include garbage which was generated during the first time measurement. Thus, conversely, the second time has a disadvantage at this point. It means right benchmarking is what making measurements to stand on the same start line and thus we need to have finish optimization and memory cleaning before measuring.
Solving the problems by yourself is OK, but there is a benchmarking framework for Groovy, GBench. GBench 0.3.0 has got a feature to solve that tiresome problems and get correct results in place of you. The following code is a rewrite using GBench. You can get a simple report that shows only execution time by setting measureCpuTime to false for disabling measurement of CPU time:
import gbench.*

new BenchmarkBuilder().run(measureCpuTime:false) {
    'StringBuilder' {
        def sb = new StringBuilder()
        sb.append('foo')
        sb.append('bar')
        sb.append('baz')
        sb.toString()
    }
    'StringBuffer' {
        def sb = new StringBuffer()
        sb.append('foo')
        sb.append('bar')
        sb.append('baz')
        sb.toString()
    }
}.prettyPrint()
The result of the code was as follows. Why the difference was not so much is because my environment is Server VM and operations of locking were optimized. Jeroen Borgers' article Do Java 6 threading optimizations actually work? is a good reference for optimizations around locking:
StringBuilder   244 (1)
StringBuffer    265 (1.08)
The result of the same code with disabling the optimizations (-XX:-DoEscapeAnalysis -XX:-EliminateLocks -XX:-UseBiasedLocking) was as follows:
StringBuilder   242 (1)
StringBuffer    310 (1.28)